Forgottonia: Smaller, Older, Poorer
by John Johnson
Unless you live there, you’ve probably never heard of Forgottonia. Beginning in the late 1960s, people in the 16-county region that makes up Illinois’ westernmost bulge along the Mississippi River began promoting a thoroughly tongue-in-cheek secessionist movement. Their grievance? Being forgotten by infrastructure improvement projects and business development.
 Local Western Illinois University student Neil Gamm became the governor of the new state (republic?) whose capital was the unincorporated town of Fandon. Given that the official Forgottonia flag was the white banner of surrender, Gamm described the movement’s strategy this way, “The idea is that we would secede from the Union, immediately declare war, surrender, then apply for foreign aid.”[1]
Despite this bit of local color, Forgottonia is a good stand-in for the fate of much of rural America. The secessionist movement did bring a bit of much-needed attention to the region (Amtrak reinstated passenger rail service, for instance), but for the most part Western Illinois has continued to suffer from protracted interrelated crises of demographics and economics. Farmers made up 4.6% of the labor force in 1970, but by 2010 this had fallen over half.[2] The rust belt manufacturing collapse simultaneously wreaked havoc on the region.
None of this is news to the people who live in places like Forgottonia. They recognize this reality every time they drive past another decrepit closed school or rotting farmstead. Its social consequences are clear in the empty pseudoephedrine packages that litter the ditches near amateur meth kitchens.
Here are three graphs illustrating the decline of Forgottonia. All data is from the U.S. Census Bureau and the Bureau of Labor Statistics. All dollars are inflation-adjusted to current (2016) values per the BLS official calculator.
The U.S. population grew 36.6% from 1980 to 2010. In Forgottonia, it shrank 12.1% in the same period.
Population, Labor Force, and Unemployment Rate in Forgottonia
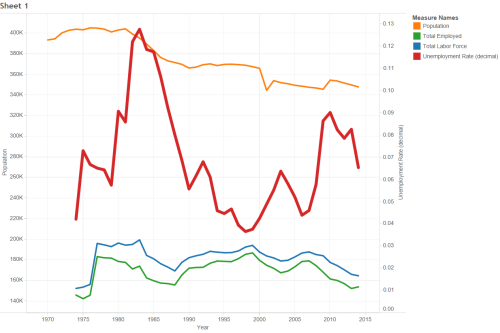
The yellow line shows the steady decline in the region’s population. The thicker red line shows the unemployment rate (corresponding to the right-hand axis). Unemployment topped 12% in the early 1980s—precipitating a population slide that ebbed in the 90s, but has continued more recently. We shall have to wait and see if the Great Recession-era unemployment spike, coupled with Illinois’ ongoing budget woes, contributes to another steep population slide.
Another reason for Forgottonia’s declining population is its aging population. I’ve constructed population pyramids for each census year since 1970. These are shown in the gif below. Each bar represents the percentage of the population in each age group by gender. Grey bars represent females; blue bars represent males. The steady flattening of the “pyramid” illustrates the growing age of Western Illinois.
Forgottonia Population Pyramids

Finally, the last graph shows Forgottonia’s median household income as compared to the U.S. median household income for the years 1969, 1979, 1989, 1999, and 2009. Unsurprisingly, Forgottonia is poorer—as much as $10,000 annually from time to time. The 1980s, once again, were particularly harsh. Perhaps most significantly, household income in 2009 is actually less than it was in 1979.
Median Household Income: 1969, 1979, 1989, 1999, 2009

The American Dream is not working for most people in Forgottonia, and this disillusionment is reflected in the region’s politics. In the March 2016 presidential primaries avowedly anti-establishment candidates took the majority of counties. Sanders won 9 of the Democratic contests, while Trump won all but one on the GOP side.
[1] http://www.disappearingman.com/illinois/remembering-our-51st-state-forgottonia/
[2] https://www.agclassroom.org/gan/timeline/farmers_land.htm; http://www.fb.org/newsroom/fastfacts/

Good Job–very interesting–not a slap in the face–not a kick in the pants–just a graphic way to show what has taken place–more bumps in the road ahead ?!
LikeLike
Hmmmm home unsweetened home
LikeLike
These graphics remind me that the policies of the Reagan years were not kind to our region, and I’ve always been a bit mystified by the nostalgia for them. Reaganomics may have helped some parts of the country, but the loss of manufacturing and of family farms led to mass exodus from Forgottonia.
LikeLike
Wasn’t in fact the Clinton economics and NAFTA that hurt this area, my area?
LikeLike
Absolutely not, Reagonomics is the main reason. Everything we bought doubled and tripled in price, but what we sold deflated in value. The worst year was in 1987, when corn sold for $1.85 a bushel, but a tractor that was bought in 1980 tripled in price. The next year was a dought year, so the price rebounded a little, but when you have nothing to sell, it really does not make any difference. Then interest rate went from 7% to 18%. almost every young person left the area to find employment. There is now a big hole of farmers aged 40 to 55
LikeLike
these stats say the 89’s hurt not the 90’s. The 89’s belong to Reagan
LikeLike
the graphs show the decline in the 80’s not the 90’s. The 80’s belong to Reagan.
LikeLike
Not knowing any different, western Illinois was a wonderful place to be raised. Great people, wide open spaces, corn and beans as far as you could see. My farmer friends were always well to do, but rarely displayed their wealth excepting the tools of their trade; fine trucks, combines, tractors, all of which were air conditioned! Those who chose to become factory workers, don’t have much to show for their efforts. I left Forgotonia in the early 70’s, so maybe I can’t relate anymore.
LikeLike
a nice to be FROM.
LikeLike
There is something to be said for a place that is not being overcrowded. The values of peace and “elbow room” should not be discounted.
LikeLike
I grew up in laharpe that area Hancock McDonough and Henderson county then you have Lee and des moines county in Iowa those are my roots haha long live forgottonia!
LikeLike
WELL, Being From this area my whole life.. I did leave breifly for Military Service only to return to raise my own family, I joined the National Guard and worked full time for them and retired young which better suited family life… Now that they are nearly raised.. I partially regret being here, only because of lack of opportunity for my children and I will encourage them to leave.. I Love this area. It is Beautiful.. the Two Rivers Region is wonderful and full of good people, but yes economically repressed is an understatement. My husband and I farm and are doing well, but we certainly understand the struggles of so many of our friends. Yes Forgottonia is an understatement and if we could leave.. I believe we might, maybe someday we will.
LikeLike